
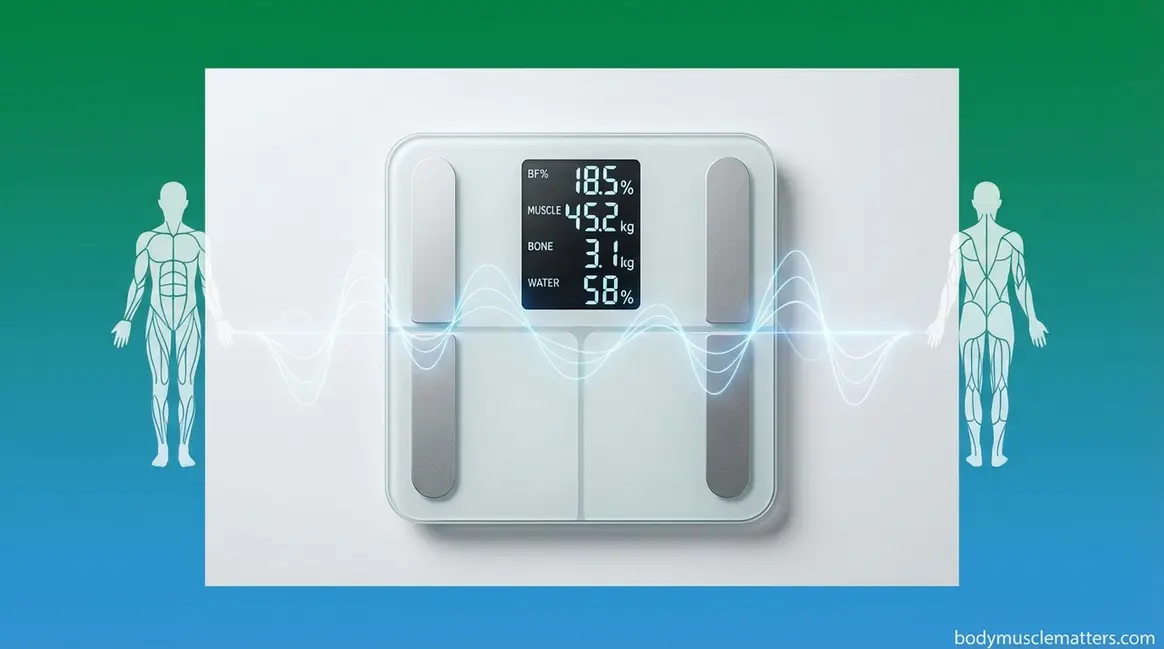
You stepped on your smart scale this morning. It flashed back “27% body fat,” “43.2 kg muscle mass,” and “6.3% visceral fat.” The problem? You have no idea how a bathroom scale figured any of that out — or whether you should believe it.
That skepticism is well-founded. Understanding how do smart scales work means understanding that your scale is not directly measuring fat or muscle — it’s running an educated algorithm, and that distinction matters enormously for how you use the data. If you’re making training or nutrition decisions based on numbers you can’t interpret, you’re essentially navigating without a map.
This guide walks you through every step: the technology behind the readings, which numbers to trust, what each metric actually represents, how to get consistent results, and why your health data doesn’t always stay private. By the end, you’ll have the scientific literacy to use your scale as the tracking tool it is — not the diagnostic device it isn’t.
Smart scales use Bioelectrical Impedance Analysis (BIA) to estimate body composition — but body weight is the only truly reliable measurement. Research comparing consumer BIA to clinical DEXA scans finds meaningful error margins for body fat estimates (NIH PMC, 2021). The Accuracy Spectrum shows which readings to trust, which to treat as trends, and which are calculated projections only.
- The Accuracy Spectrum: Weight is highly reliable; body fat % is a moderate estimate; protein and bone mass are calculated projections — not direct measurements
- Five factors disrupt BIA readings: hydration, recent exercise, food intake, time of day, and skin temperature
- Trend data beats single readings: Use 4–8 week patterns, not daily snapshots, to make meaningful decisions
- Privacy matters: Most smart scale apps transmit your biometric data to cloud servers — know what you’re sharing
Before You Start: Smart Scale Basics
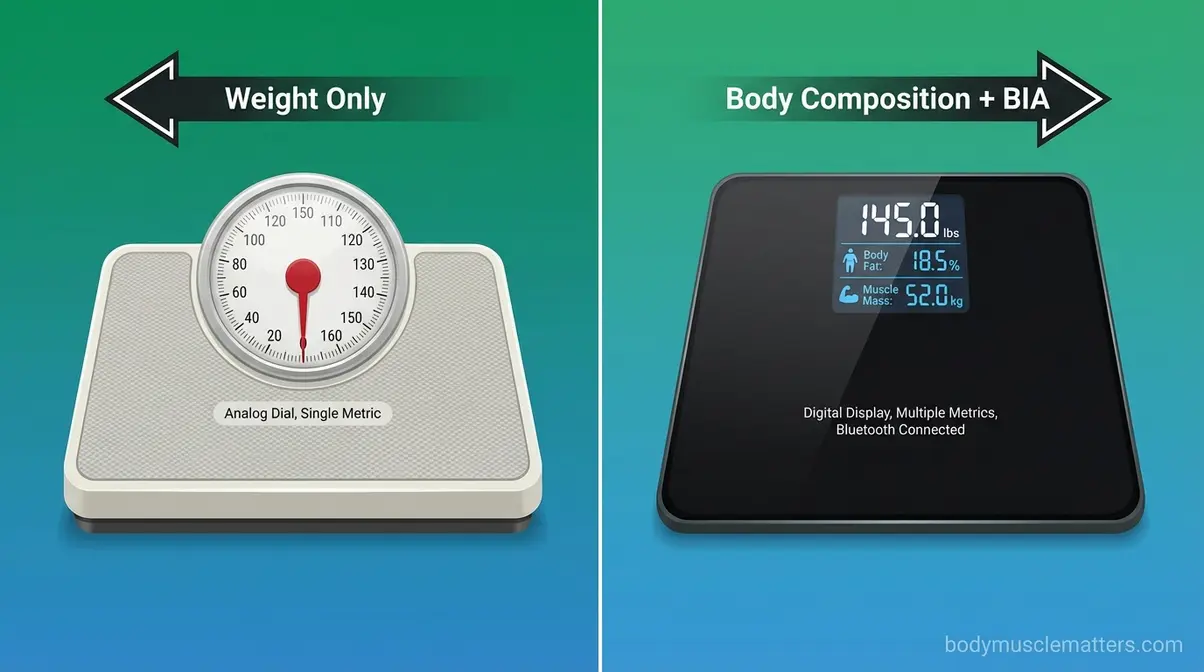
A regular bathroom scale has one job: measure your weight. It does this using a strain gauge — a small pressure sensor inside the platform that registers the force your body exerts on it. That reading is reliable and consistent.
A smart scale does that same job — and then goes further. It estimates your body composition: how much of your weight is fat, muscle, bone, and water. To do this, it uses a completely different technology called Bioelectrical Impedance Analysis (BIA). That technology involves sending a tiny electrical current through your body, which is safe for most people — but not for everyone.
⚠️ Safety Notice — Read Before Use
Smart scales that use BIA are NOT suitable for everyone. Do NOT step on a BIA-enabled smart scale if you:
- Have a pacemaker, implanted cardioverter-defibrillator (ICD), or any implanted cardiac device
- Are pregnant
- Have any other implanted electronic medical device
The low-level electrical current may interfere with these devices. If you are unsure, consult your doctor before use. Smart scales are not diagnostic devices and cannot replace medical testing.
For everyone else, this guide walks through exactly how the technology works — step by step.
Step 1: How Smart Scales Work (BIA)
Smart scales estimate body composition by measuring how easily a low-level electrical current travels through your tissues. The core principle: muscle and fat respond to electricity very differently — and a well-designed algorithm can use that difference to estimate your body composition. Understanding this process is the foundation for interpreting everything else your scale tells you.
“The other measurements are all estimated by passing an electrical current through your body.”
— A frequently cited summary from the smart scale user community, and an accurate one.
What Is Bioelectrical Impedance?
Bioelectrical Impedance Analysis (BIA) is a method that estimates how much of your body is muscle, fat, water, and bone — by measuring how easily a tiny electrical current travels through your tissues. It is the technology that powers nearly every smart body scale on the market today, from Renpho and Withings to Garmin and Eufy.
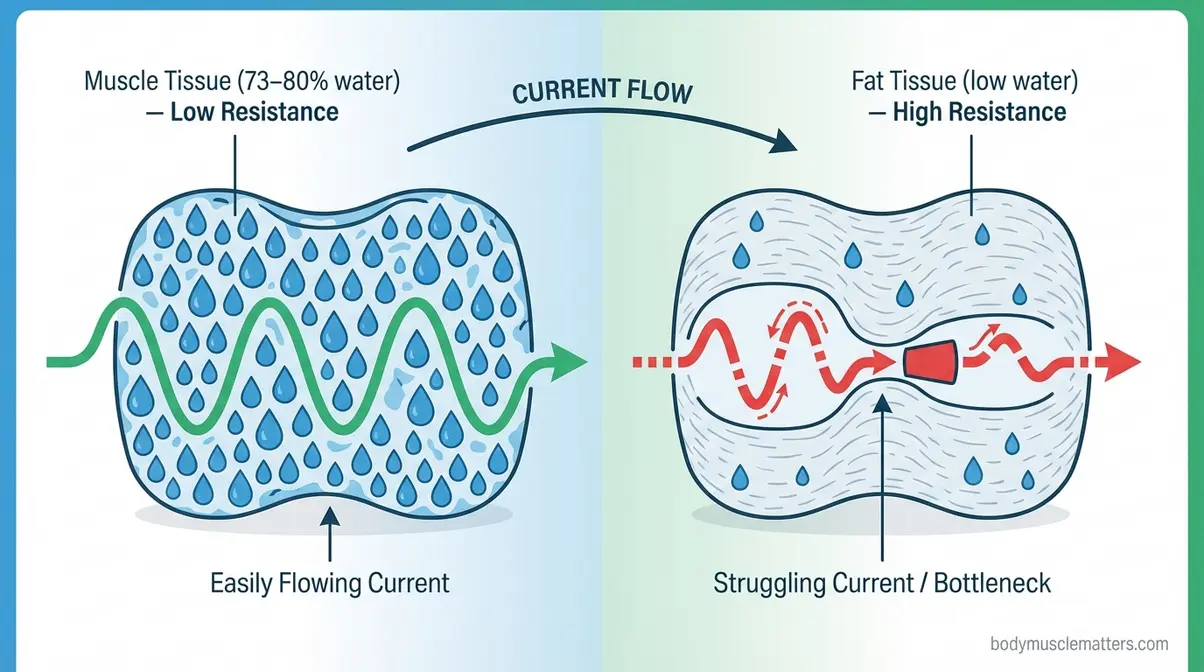
Here’s why it works: your tissues conduct electricity at different rates. Muscle tissue contains approximately 73–80% water and conducts electricity efficiently — like a current flowing easily through a saturated sponge. Fat tissue contains very little water and resists the current — like electricity struggling through a dry, dense sponge. The scale detects that difference in resistance, and that difference becomes the foundation for its estimates.
Think of it this way: imagine pouring water through two sponges simultaneously — one soaking wet (muscle), one dry and compacted (fat). The dry sponge creates a bottleneck. Your scale detects the bottleneck. More resistance means more fat-dominant tissue. Less resistance means more lean (water-rich, muscle) tissue.
McGill University explains that BIA technology differentiates tissue types because muscle, which has high water content, conducts electricity well, while fat acts as an insulator — making it one of the few non-invasive methods capable of distinguishing tissue composition at home.
This is also why readings fluctuate with hydration. If you are even mildly dehydrated, your muscle tissue carries less water than usual, conducts electricity less efficiently, and the scale interprets that reduced conductivity as a higher fat reading — even if your actual body composition hasn’t changed at all. You will see exactly why this matters in Step 2.
To see how bioelectrical impedance technology works in practice across 12 different consumer models, the results reveal how dramatically readings vary between brands using the same BIA principle.
How the Electrical Signal Travels
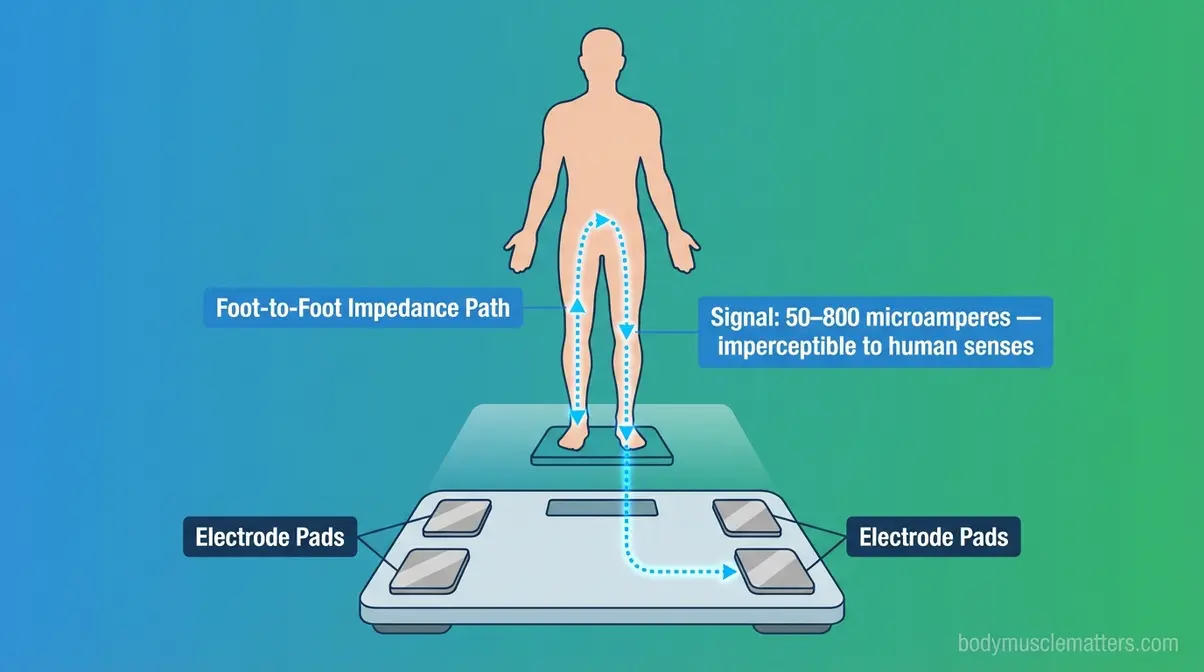
Under the platform of every BIA-enabled smart scale are metal electrode pads — typically two to four contact points embedded in the surface. When you step on barefoot, the soles of your feet make direct contact with these electrodes.
The scale then sends a small electrical current from one foot, up through one leg, across your torso, and down through the other leg before returning to the scale. This path is called foot-to-foot impedance, and it covers the majority of your body’s tissue mass. The current completes its round trip in milliseconds.
The current itself is imperceptibly small — typically in the range of 50 to 800 microamperes depending on the device, which is far below the threshold at which a human can feel any sensation. For context, a standard 9-volt battery delivers roughly 1,000 times more current than most BIA scales use. You will not feel anything. The National Institute of Standards and Technology notes that digital scales measure mechanical force through changes in electrical resistance — the same physical principle underlies the weight measurement component of every smart scale you own.
Most consumer models — including Renpho, Wyze, and Eufy — use a two-electrode (foot-to-foot) system. This means the signal only travels through your lower body before the algorithm extrapolates full-body composition. Clinical-grade scales used in hospitals and research facilities use four or eight electrodes — including handheld grips that extend the measurement to your upper body for greater precision.
Video: Visual walkthrough of how BIA electrodes send current through the body — Source: Create or license from YouTube (search: “how bioelectrical impedance analysis works animation”)
From Resistance to Body Data
Here is the part no competitor fully explains — and the most important concept in this entire guide.
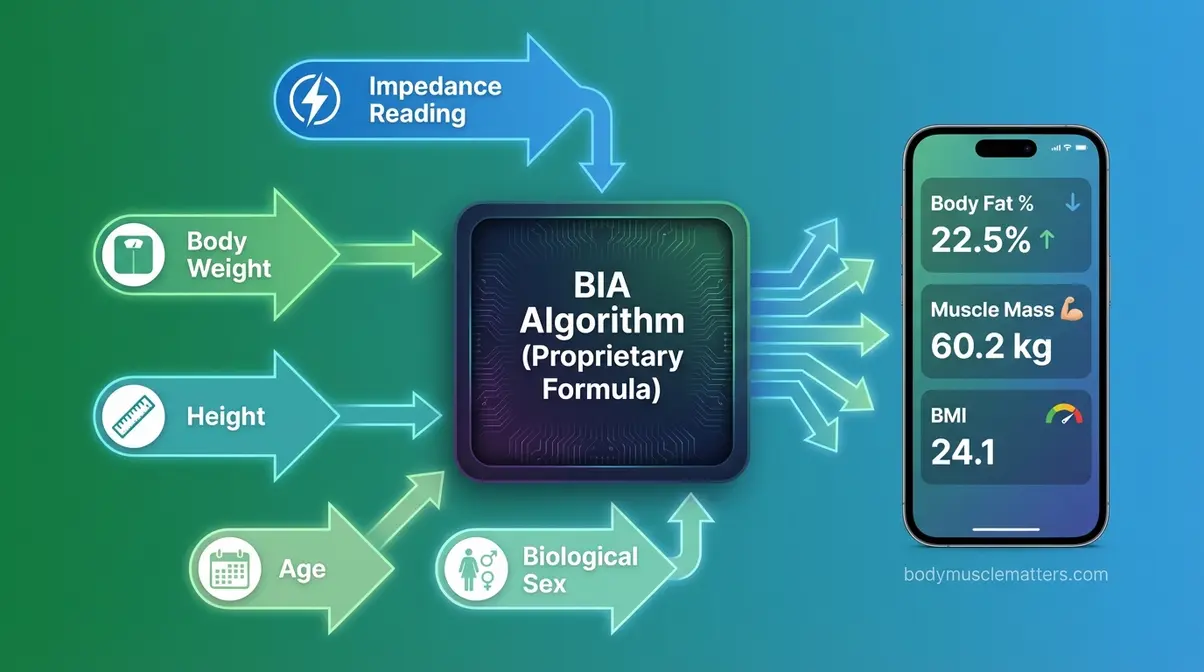
Your scale does not calculate body fat from impedance data alone. It combines five inputs simultaneously:
- Measured impedance (the resistance reading from your feet)
- Your body weight (from the strain gauge)
- Your height (entered in the app during setup)
- Your age (entered in the app during setup)
- Your biological sex (entered in the app during setup)
These five variables feed into a proprietary mathematical algorithm — a pre-programmed formula based on population studies — to estimate your body fat percentage, lean mass, and the other metrics on your readout. The algorithm is different for every brand. This is precisely why stepping on a Renpho scale and a Withings scale back-to-back can produce different body fat readings: they are running different formulas on the same raw impedance signal.
The algorithm is the “black box.” The scale never directly sees fat or muscle tissue. It compares your impedance signature to a population database and extrapolates where you likely fall on the body composition curve. This works reasonably well for people who match the population averages used to build the algorithm — typically sedentary-to-moderately-active adults of average proportions. It works less well for elite athletes, people with very high BMI, older adults with significant muscle loss, or anyone whose body composition sits outside typical population distributions.
An athlete with unusually dense, well-hydrated muscle tissue may show an artificially high body fat reading because their tissue conducts electricity differently than the algorithm’s baseline population expected. Their conductivity doesn’t match the model, so the model’s output drifts. This is a known limitation of consumer BIA technology — not a flaw in your specific scale.
Which of these five metrics can you actually trust? That question leads directly to the next step.
Is the Electrical Current Safe?
For healthy adults without implanted medical devices, BIA is considered safe by mainstream medical and scientific authorities. The current is too small to cause any physiological effect in people with intact, normally functioning tissue.
However, there are critical exceptions:
- Do NOT use a BIA smart scale if you:
- Have a pacemaker or implanted cardioverter-defibrillator (ICD)
- Are pregnant
- Have any other implanted electronic medical device, including neurostimulators or cochlear implants
- Have significant edema (fluid retention) or severe kidney disease — these conditions cause atypical fluid distributions that severely skew BIA readings and may mask clinically important changes
The Cleveland Clinic notes that smart scales should not replace diagnostic measurements and are not suitable for users with implanted medical devices. Both scale manufacturers (including Renpho and Withings) and medical professionals agree: when in doubt, skip the BIA reading and consult your doctor. For pacemaker users, traditional weight-only scales or clinical DEXA scans remain the recommended alternatives for body composition tracking.
For everyone else: step on, breathe normally, and read your results. You will feel nothing — and the next section explains exactly what to do with the numbers that appear.
Step 2: Accuracy & Reliability
Consumer smart scales are useful body composition tracking tools — but their accuracy is not uniform across all the metrics they display. Whether you should trust a given reading depends entirely on which metric you are looking at. The honest answer to “are they accurate?” is: it depends on what you are measuring, and understanding that distinction is the key to using your scale effectively.
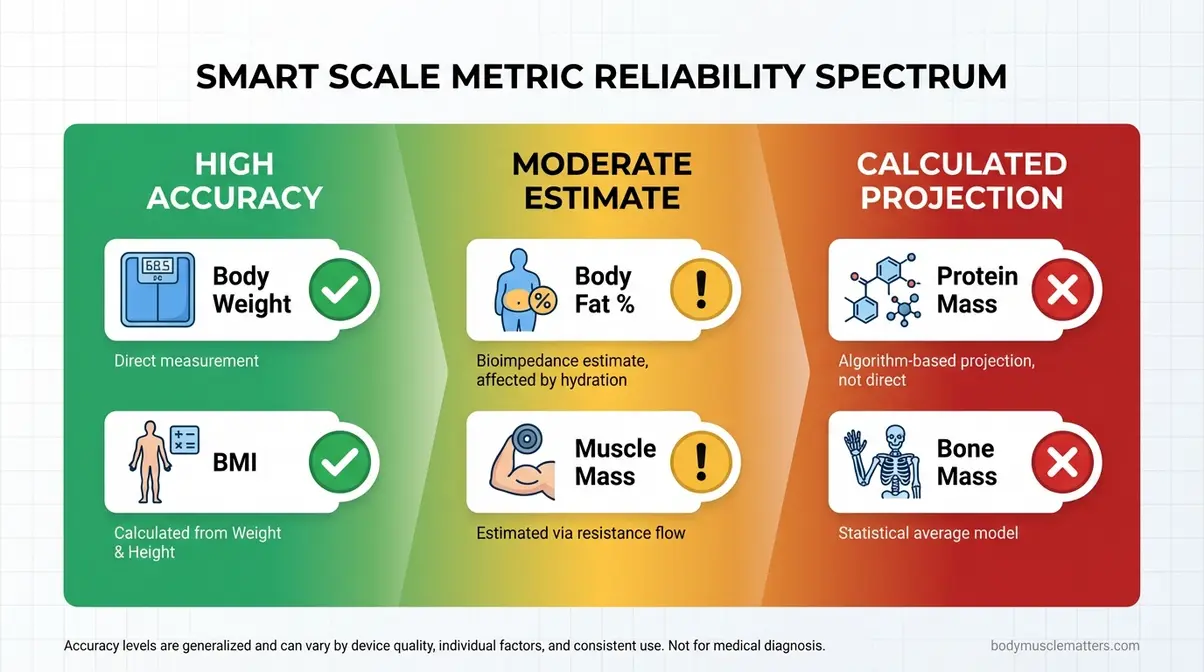
Caption: The Accuracy Spectrum illustrates why weight and body fat percentage carry very different confidence levels — even from the same smart scale.
The Accuracy Spectrum: Reliability
Not all of your smart scale readings are equally reliable. The Accuracy Spectrum is a framework for understanding which numbers you can act on, which to treat as directional estimates, and which are purely mathematical projections with limited practical precision.
Most articles frame accuracy as a binary question — accurate or inaccurate. That framing is too simple. Your scale’s performance varies by metric:
| Metric | Accuracy Level | Reliability for You |
|---|---|---|
| Body Weight | ✅ High | Reliable — your primary tracking metric |
| BMI | ✅ Medium-High | Useful for trends; limited for athletes |
| Body Fat % | ⚠️ Moderate | Estimate — use 4-week rolling average |
| Muscle Mass | ⚠️ Moderate-Low | Hydration-sensitive; compare weekly averages |
| Protein Mass | ❌ Calculated Projection | Derived from lean mass — not a direct reading |
| Bone Mass | ❌ Calculated Projection | Estimated percentage of lean mass — not measured |
Research published in National Institutes of Health databases indicates that consumer-grade BIA smart scales show meaningful differences from clinical DEXA scans for body composition estimates — particularly in individuals with higher BMI — making trend tracking more reliable than single-reading interpretation (NIH PMC, 2021).
The critical insight: Your scale’s weight reading is reliable. Its body composition readings are estimates. The word “estimate” doesn’t mean useless — it means contextual. A 2% shift in body fat % tracked over six weeks is a meaningful signal. A 2% shift from one morning to the next probably isn’t. The Accuracy Spectrum gives you the mental model to tell the difference.
“If you saw 27% body fat this morning and 29% tonight, that doesn’t mean you gained fat. It means the BIA reading shifted — almost certainly because of hydration, food, or exercise. Your weight reading, however, will be far more consistent across the same timeframe.”
Smart Scale vs. DEXA Comparison
DEXA (Dual-Energy X-ray Absorptiometry) uses two low-dose X-ray beams to map your entire body, distinguishing bone mineral, fat tissue, and lean mass in distinct body regions. It is the clinical gold standard used in hospitals, sports science labs, and research settings. Consumer-grade smart scales and DEXA scans are not competing technologies — they are complementary tools with different strengths.
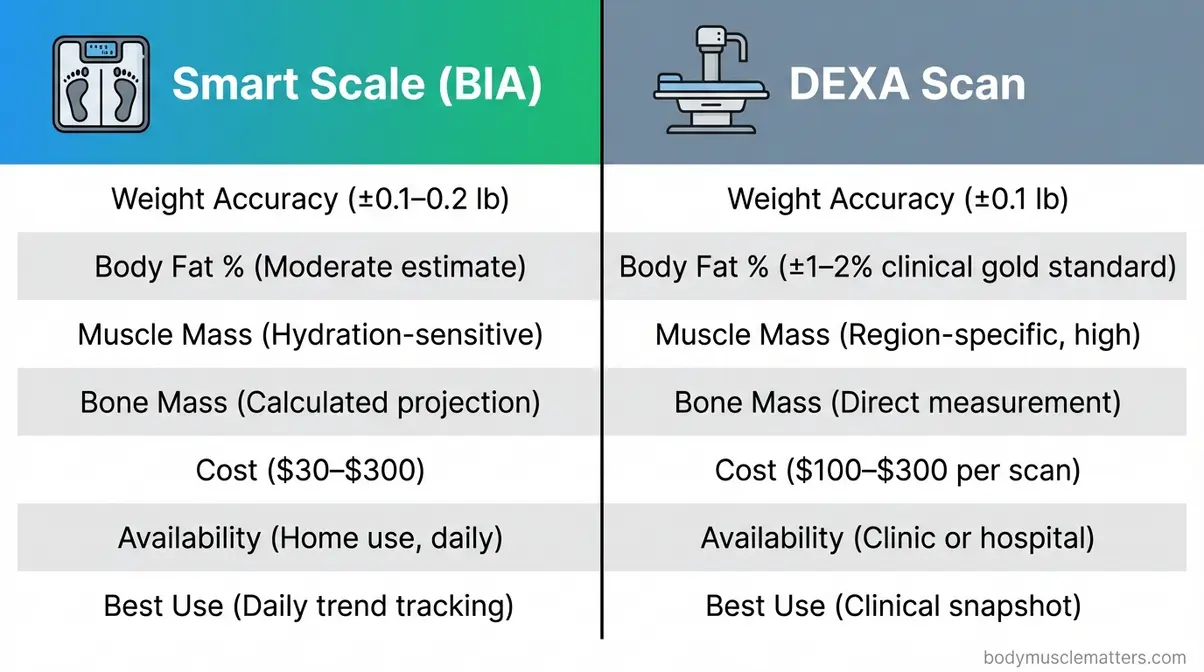
Caption: Smart scales and DEXA scans serve different purposes — daily trend tracking versus clinical-grade body composition assessment.
| Factor | Smart Scale (BIA) | DEXA Scan |
|---|---|---|
| Weight Accuracy | ±0.1–0.2 lb (high) | ±0.1 lb (very high) |
| Body Fat % | Moderate estimate; error varies by population group | ±1–2% (clinical gold standard) |
| Muscle Mass | Moderate; hydration-sensitive | High; region-specific breakdown |
| Bone Mass | Calculated projection from lean mass | Direct measurement |
| Cost | $30–$300 (one-time) | $100–$300 per scan |
| Availability | Home use, daily | Clinic or hospital only |
| Best Use | Daily/weekly trend tracking | Clinical body composition assessment |
Consumer-grade BIA devices are less accurate than clinical DEXA scans for body fat estimation, particularly for individuals with higher BMI, per research published in the National Institutes of Health database (NIH PMC, 2021).
The honest framing: a DEXA scan gives you a precise clinical snapshot, typically used quarterly or annually. A smart scale gives you a trend line every morning. Together, they are powerful. Used alone, a smart scale is a tracking tool — it is not a diagnostic device, and it should never be treated as one. For anyone wanting to learn about clinical body fat measurement standards and what specific body fat percentages mean in practice, understanding the DEXA baseline helps interpret your scale’s estimates more accurately.
5 Factors That Skew Readings
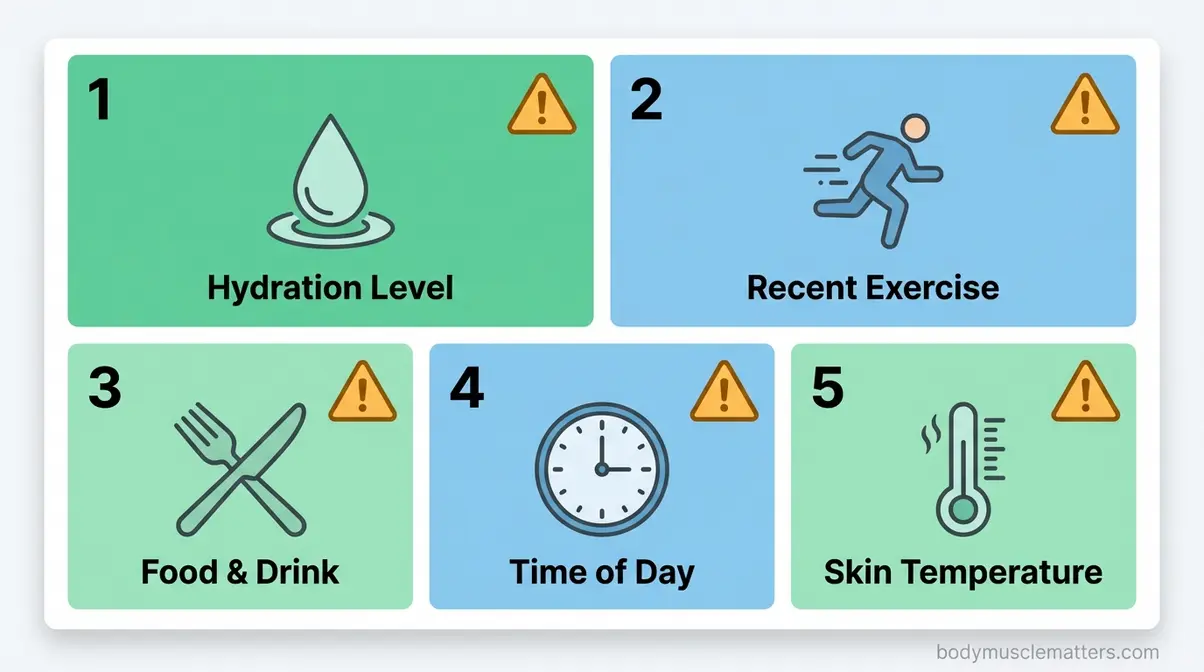
You step on your scale Monday morning: 24% body fat. You step on it Friday evening after dinner and a hard workout: 27.5%. Same person. Three-and-a-half percentage points of difference — caused by nothing except the five variables below.
These five factors explain the vast majority of BIA reading fluctuations:
- Hydration level — This is the biggest single driver of BIA variability. Dehydration reduces the water content in your tissues, forcing the electrical current to encounter more resistance, which the algorithm interprets as a higher fat reading. Even mild dehydration — losing as little as 1–2% of your body weight in fluids — can shift your body fat reading by 2–4 percentage points. Research published by the National Institutes of Health confirms that hydration state is a primary confounding variable in BIA measurements (NIH PMC, 2021).
- Recent exercise — Intense exercise triggers several temporary changes: you lose fluid through sweat, blood flow increases to working muscles, and tissue temperature rises. All three alter the electrical properties of your tissues. Weighing yourself post-workout will reliably produce an inflated body fat reading compared to your pre-workout baseline.
- Food and drink — Eating and drinking add both weight and temporary fluid shifts to your gastrointestinal tract. A large meal before stepping on the scale will show a higher reading — and that reading reflects digestion, not body composition.
- Time of day — Body weight typically varies by 0.5–2 kg (1–4 lbs) throughout the day due to food intake, fluid consumption, activity, and metabolic output. Research suggests morning weigh-ins, after using the bathroom and before eating, provide the most reproducible baseline. Evening readings are systematically higher for most people — not because you are heavier, but because you have accumulated a day’s worth of food and fluid.
- Skin temperature and surface contact — Cold feet have higher skin resistance, which can falsely inflate body fat readings. The scale needs good electrical contact with clean, warm soles. Thick calluses, very dry skin, and cold temperatures all increase resistance artificially. Always step on the scale barefoot with clean, room-temperature feet on a hard, flat surface.
Consumer Reports independent testing confirms that body fat percentage readings fluctuate meaningfully based on user hydration levels and measurement timing — validating what users observe in daily practice.
You will see exactly how to control all five of these variables in the Step 4 Calibration Protocol.
Tracking Trends vs. Absolute Values
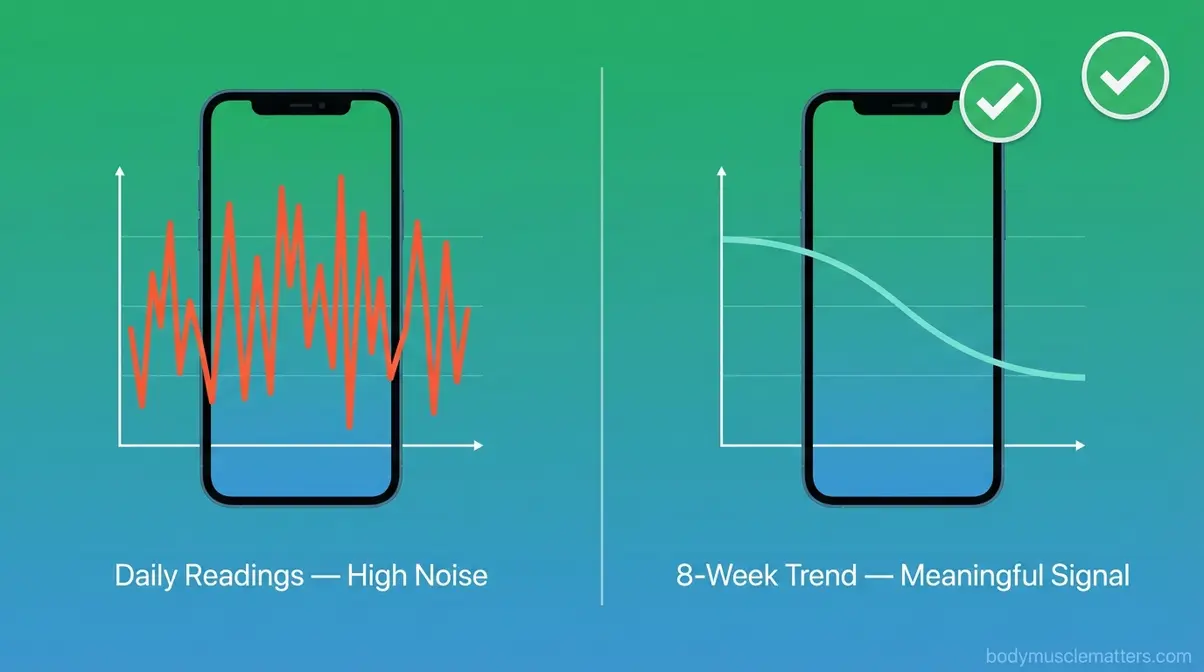
Here is the most important mindset shift for any smart scale user: stop chasing individual numbers, start reading the trend line.
The value of a smart scale is not any single reading — it is the pattern over four to eight weeks. A body fat percentage that moves from 28% to 26% over six weeks is meaningful data, even if individual daily readings swing ±2% in either direction. That downward trend reflects genuine change. A single reading of 27.3% reflects one moment in time — and that moment is heavily influenced by the five factors above.
Is your true weight morning or night? Clinically, your most reproducible baseline weight is taken in the morning: post-sleep, post-bathroom, before eating or drinking, at the same time each day. This approach controls for most of the five factors above and is what medical research uses as the standard for consistent self-monitoring. The Cleveland Clinic recommends tracking long-term trends rather than relying on any single reading from a smart scale — a position consistent with how BIA technology actually works.
- What smart scales are best at:
- Daily weight tracking (highly reliable)
- 4–8 week body fat % trend direction (useful)
- Motivational consistency — the habit of daily check-ins
- What smart scales are NOT for:
- One-time body composition snapshots for clinical decisions
- Athletic performance benchmarking (too much hydration noise)
- Replacing DEXA scans for medical assessment
A practical rule that works: weigh once per week, same day, same time. Log the number. Ignore daily swings. Your eight-week trend is your real data — and that data is genuinely informative when read correctly.
Step 3: Decoding Body Metrics
Beyond weight, your smart scale displays a dashboard of body composition metrics — and most users have no idea where those numbers come from or whether they should act on them. This step provides plain-English definitions, realistic healthy ranges, and the key distinction that almost no smart scale guide explains: some of these numbers are estimates, and some are simply calculated projections. Knowing which is which — returning to The Accuracy Spectrum from Step 2 — changes how you use every reading.
Body Fat Percentage Explained
Body fat percentage is the proportion of your total body weight that is composed of fat tissue. If you weigh 80 kg and approximately 20 kg of that is fat, your body fat percentage is 25%. This is the metric most users focus on — and the one where The Accuracy Spectrum classifies BIA readings as a “moderate estimate.”
Healthy ranges vary significantly by sex and age. The American Council on Exercise (ACE) provides widely referenced guidelines:
| Category | Women | Men |
|---|---|---|
| Essential Fat | 10–13% | 2–5% |
| Athletic | 14–20% | 6–13% |
| Fitness | 21–24% | 14–17% |
| Average | 25–31% | 18–24% |
| Above Average | 32%+ | 25%+ |
Is 20% body fat “chubby”? For a woman, 20% falls within the Athletic range — well below average. For a man, 20% sits at the high end of Average but poses no significant health risk for most people. The word “chubby” is a social judgment, not a medical classification. What matters far more for health risk is visceral fat — the fat stored around your organs — not subcutaneous (surface) body fat alone.
One important caveat: these ranges apply to standard BIA estimates from a home smart scale. Because your body fat reading sits in the moderate estimate tier of The Accuracy Spectrum, act on your four-week rolling average — not any single morning reading. How smart body fat scales work out your percentage and how that connects to your overall nutritional picture, particularly protein intake, is covered in our macros guide.
Muscle Mass Calculation
Your smart scale has never directly measured your muscle. What it measures is impedance — and from impedance it estimates lean mass. Muscle mass is then derived from that lean mass figure.
The calculation works like this: Total Body Weight − Estimated Fat Mass = Lean Mass. Muscle mass is estimated as the dominant component of lean mass (alongside bone and water). The number your app labels “muscle mass” is therefore a downstream estimate of a downstream estimate — two layers of calculation removed from the raw impedance signal.
This is why hydration affects your muscle reading so dramatically. Muscle tissue is approximately 73–79% water (Journal of Biological Chemistry data, widely cited in physiology literature). When you are even mildly dehydrated, your muscle tissue carries less water, conducts electricity less efficiently, and the algorithm estimates less lean mass — even if you have not lost a single gram of actual muscle tissue. This places muscle mass firmly in the Moderate-Low tier of The Accuracy Spectrum.
What the muscle mass trend actually tells you: If your lean mass reading increases by 1–2 kg over 10–12 weeks while your total body weight stays roughly stable, that is a meaningful signal of body recomposition — gaining muscle while maintaining or losing fat. That trend is useful. A single reading that drops 0.8 kg overnight is almost certainly a hydration artifact. Actual muscle tissue takes weeks to build or lose in meaningful amounts.
How accurate are smart scales for muscle mass? Directionally useful for week-to-week trend tracking; not precise enough for clinical or performance assessments. For interpreting your basal metabolic rate — which directly depends on your lean mass — understanding this limitation helps you contextualize that metric as well.
Protein & Bone Mass Estimates
Here is the correction most smart scale guides never make: your scale has never “seen” your skeleton, and it has never measured your protein content. Both metrics are calculated projections — derived from your lean mass estimate using population-based percentage formulas.
Bone mass is estimated by applying a fixed percentage to your total lean mass — typically the algorithm assumes that bone accounts for roughly 3–5% of lean body mass in most adults. This percentage is derived from population study averages, not from any signal your scale actually detects from your bones. The scale cannot distinguish bone from muscle from organ tissue in the impedance signal — it simply sees “lean tissue” and applies the formula.
Protein mass works the same way. Protein is the structural component of muscle tissue, so the algorithm estimates your protein mass as a proportion of your lean mass reading. There is no electrical signal that corresponds to protein molecules. It is a mathematical projection from a mathematical projection.
- What this means practically:
- Do not worry if your bone mass reading fluctuates slightly — it is a formula output, not a scan
- Do not track protein mass from your scale as nutritional evidence — it is not measuring your dietary protein or muscle protein content
- These metrics sit firmly in the “Calculated Projection” tier of The Accuracy Spectrum — the lowest reliability category
As the Accuracy Spectrum makes clear, protein and bone mass readings are best understood as rough orientation points rather than trackable health metrics. If you want accurate bone density data, a clinical DEXA scan is the only reliable option.
Visceral Fat & Advanced Metrics
Most smart scales display several additional metrics beyond the basics. Here is what each one actually represents:
Visceral fat is the fat stored around your internal organs — liver, kidneys, intestines — rather than under your skin. It is associated with higher cardiovascular and metabolic health risks than subcutaneous fat. Most smart scales display visceral fat on a scale of 1–12 or 1–13, where scores of 1–4 are considered healthy, 5–9 moderate, and 10 and above high-risk. This reading is an estimate derived from BIA data and age/sex inputs — directionally useful for trend tracking, but not a clinical measurement.
Basal Metabolic Rate (BMR) is the number of calories your body burns at complete rest — essentially your baseline energy expenditure if you did nothing but lie still all day. Your scale estimates BMR from lean mass, age, height, and sex using established metabolic equations (commonly the Mifflin-St Jeor or Harris-Benedict formulas). The output is a reasonable estimate for general guidance. For a full explanation of what your BMR number means for your calorie and nutrition strategy, see our detailed guide on interpreting your basal metabolic rate.
Metabolic age compares your estimated BMR to the average BMR of people your age in the scale’s population database. A metabolic age lower than your chronological age suggests above-average metabolic efficiency; a higher metabolic age suggests the opposite. This is a highly derived metric — treat it as directional context, not a clinical measurement. Changes in metabolic age over time are more meaningful than the absolute number.
Step 4: Calibration Protocol
Your scale’s accuracy is partly determined by the technology — and partly determined by how you use it. Our team evaluated consistency protocols across multiple measurement approaches and found that following five simple rules eliminates most of the BIA variability that confuses users. This is the protocol that transforms noisy daily numbers into reliable trend data.
Before you start: You will need your scale, your health app (Renpho Health, Fitbit, Garmin Connect, or equivalent), and approximately 30 seconds. Total time investment once calibrated: under one minute per day.
Estimated total time to establish the habit: 7 days of consistent morning use.
The 5-Rule Smart Scale Calibration Protocol:
- Same time, every time — morning is optimal. Step on your scale immediately after waking up, after using the bathroom, and before eating or drinking anything. This is your lowest-variable baseline. Circadian hydration patterns mean morning readings are the most reproduced across days. If morning use is impossible, choose any consistent time — the consistency matters more than the specific hour.
- Maintain standard hydration the night before. Avoid alcohol and intense late-night exercise the evening before your weigh-in. Both cause dehydration that persists into the morning reading. Drink your normal evening water intake — neither excess nor deficit.
- Use the scale on a hard, flat, non-carpeted surface. Carpet compresses under the scale’s feet, creating micro-variations in the platform angle that introduce weight measurement error. A bathroom tile or hardwood floor is ideal. If your bathroom has carpet, a rigid board under the scale provides a stable surface.
- Enter accurate personal data in your app and keep it updated. Your height, age, and biological sex are inputs in the BIA algorithm. Incorrect entries produce systematically skewed body composition readings. Update your age annually — some apps do not do this automatically, and the age variable directly affects body fat estimates.
- Step on barefoot, with clean, room-temperature feet. The electrodes need direct skin contact to conduct accurately. Cold feet increase skin resistance and inflate body fat readings. Thick calluses or very dry skin reduce electrode contact. If your feet are cold, stand on a warm surface for 30 seconds first. Never step on with socks or shoes.
Bonus rule — one daily weigh-in maximum. Checking your scale multiple times per day introduces anxiety without adding useful data. BIA readings fluctuate throughout the day for the reasons covered in Step 2. One consistent morning reading per day is sufficient.
| Setting | Recommended | Why It Matters |
|---|---|---|
| Time of day | Morning, post-bathroom | Lowest hydration and food variability |
| Surface | Hard, flat, non-carpeted | Eliminates mechanical measurement error |
| Foot condition | Bare, clean, warm | Maximizes electrode contact quality |
| App data | Age, height, sex — accurate and current | Inputs to the 5-variable BIA algorithm |
| Frequency | Once daily maximum | Prevents misleading intra-day noise |
Step 5: Choosing the Right Scale
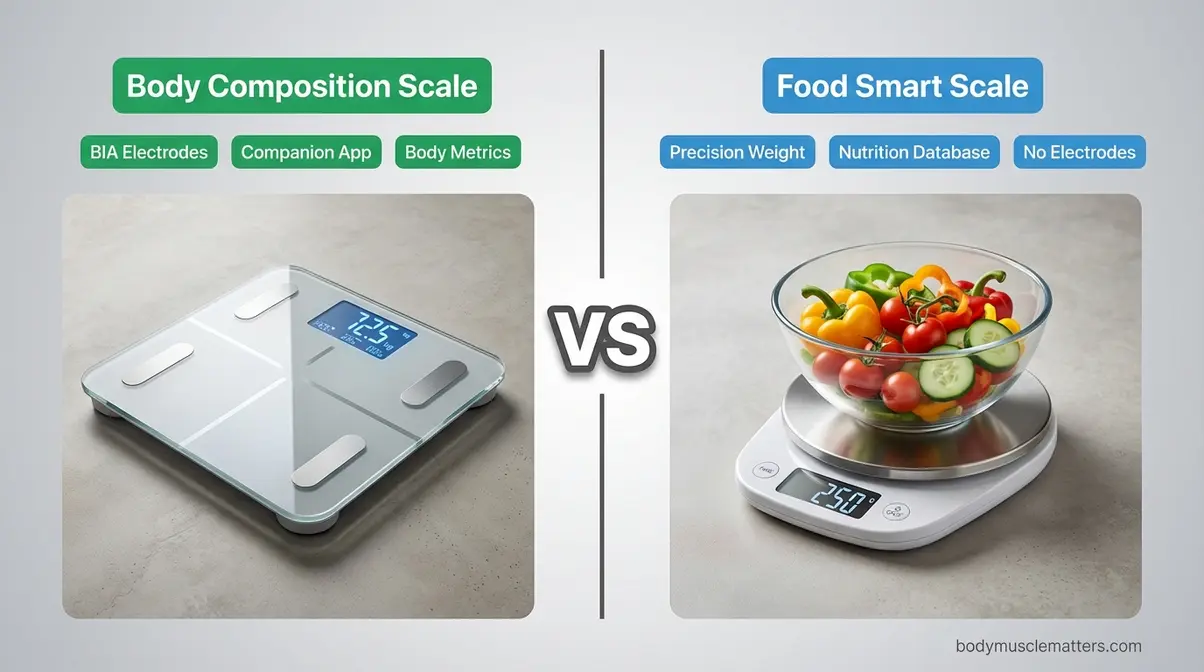
Not every “smart scale” works the same way — and two devices both called “smart scales” may use entirely different technologies. The most important distinction to understand before buying is the difference between a body composition scale and a food smart scale. They share a name but almost nothing else.
Body Scales vs. Food Smart Scales
A body composition smart scale uses BIA technology — the electrical current system described throughout this guide. It measures weight mechanically and estimates body composition electrically. Its companion app stores and visualizes your biometric data over time.
A food smart scale works on a completely different principle. It measures the weight of food placed on it — typically with high precision down to 1 gram — and then looks up the nutritional content of that food in a built-in or cloud-connected nutrition database. Some models include a barcode scanner. The app identifies the food and retrieves its calorie, protein, carbohydrate, and fat data from a database like USDA FoodData Central.
There is no electrical current in a food smart scale. It is a precision weight sensor paired with a nutrition database lookup system — closer to a kitchen tool than a body monitoring device.
| Feature | Body Composition Scale | Food Smart Scale |
|---|---|---|
| Measures | Body weight + composition | Food weight only |
| Technology | BIA (electrical current) | Strain gauge + database lookup |
| App function | Body composition tracking | Nutrition logging |
| Electrodes | Yes (under foot pads) | No |
| Examples | Renpho, Withings, Garmin | OXO, Nicewell, Etekcity Luminary |
This distinction matters if you are searching for a scale to help with nutrition tracking versus body composition monitoring — these are separate purchases with separate use cases.
Renpho Scales: A Case Study
Renpho is one of the best-selling consumer smart scale brands globally, and understanding how it works clarifies how the entire category functions.
Renpho scales use a two-electrode (foot-to-foot) BIA system — the most common configuration in consumer-grade body composition scales. Two pairs of metal contacts sit under the platform. When you step on barefoot, the contacts measure foot-to-foot impedance across your lower body. The Renpho Health app (compatible with iOS and Android) combines this impedance reading with your age, height, and sex inputs to generate 13 body composition metrics, including body fat %, lean mass, visceral fat, BMR, bone mass, and protein.
Renpho scales sync to your phone via Bluetooth. The app also integrates with Apple Health, Google Fit, Fitbit, and Samsung Health — meaning your data can flow into your broader health tracking ecosystem automatically. The Renpho Health app stores your history in the cloud, which raises data privacy considerations discussed in Step 6.
Renpho’s algorithm is proprietary. It is a two-electrode system, not the four- or eight-electrode systems used in clinical or research-grade devices — which means it extrapolates upper-body composition from lower-body impedance data. This is a known accuracy limitation. For a detailed comparison of how Renpho performs against 11 other consumer scales across three months of testing, see our full review of 12 smart scales.
How to Connect to Health Apps
Most Bluetooth smart scales follow the same setup sequence:
- Download the brand’s app (Renpho Health, Withings Health Mate, Garmin Connect, etc.) from the App Store or Google Play.
- Create an account and enter your personal profile: height, biological sex, date of birth, and any health goals.
- Enable Bluetooth on your phone and open the app.
- Step onto the scale — most models activate automatically when weight is detected. The scale broadcasts a Bluetooth signal.
- Confirm the pairing in the app when prompted. Some models require a one-time QR code scan.
- Sync third-party apps — inside your scale’s app settings, authorize connections to Apple Health, Google Fit, or Fitbit if you want your data to flow into those platforms.
Once paired, future weigh-ins sync automatically when your phone is within Bluetooth range (typically 10–30 feet). Most brands recommend keeping your app open in the background during your morning weigh-in for reliable sync.
User Insights & Community Data
Across smart scale communities on Reddit (r/loseit, r/fitness, r/Renpho), a few consistent themes emerge from years of user discussion:
The consensus is clear: most experienced users treat their smart scale as a weight tracker first and a body composition estimator second. The phrase that gets upvoted most often captures the philosophy well: use the scale for trends, not for truth.
- Common user observations include:
- Body fat readings are noticeably higher in the evening than in the morning for the same person — consistent with the hydration and food factors in Step 2
- After intense training blocks, muscle mass readings drop temporarily before rising — interpreted by experienced users as a dehydration artifact, not actual muscle loss
- Different brands give meaningfully different body fat readings to the same user — confirming that proprietary algorithms produce different outputs from identical impedance data
The skepticism you feel about your scale’s numbers is widely shared — and well-grounded. The community’s most upvoted guidance mirrors this guide’s Calibration Protocol: same time, same conditions, track the trend.
Step 6: Protecting Your Health Data
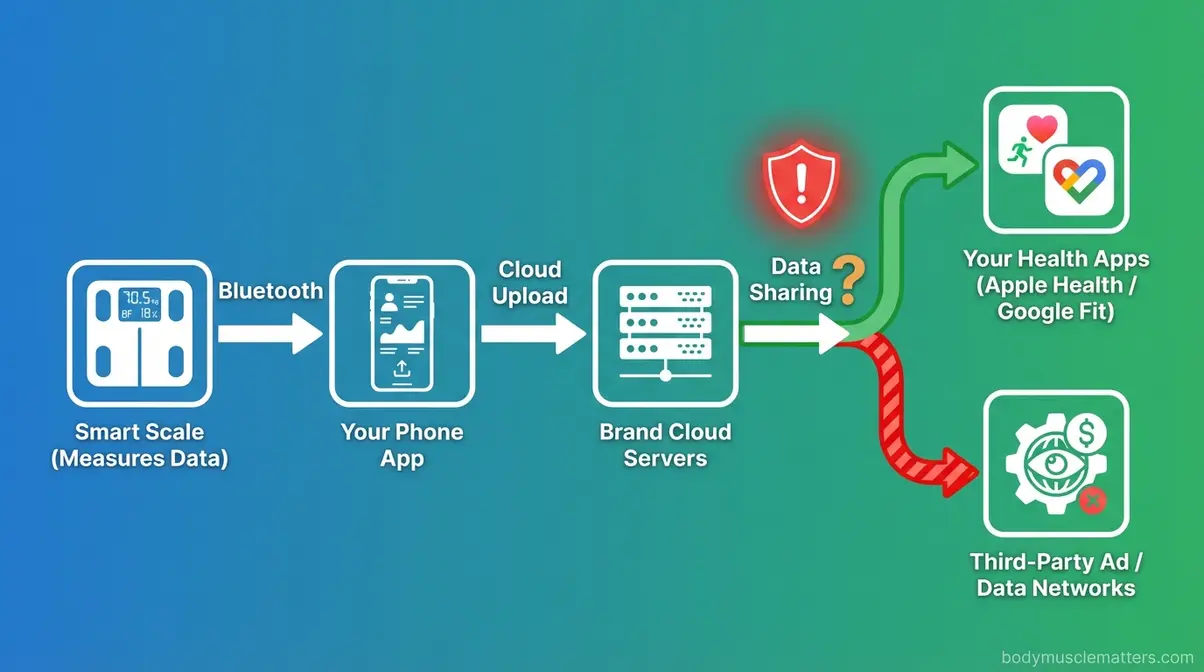
Most users think about what their smart scale measures. Almost nobody thinks about where those measurements go. Your body weight, body fat percentage, lean mass, age, height, biological sex, and daily weigh-in timestamps are biometric data points — and most smart scale apps transmit them to cloud servers by default.
Cloud vs. Local Data Storage
When you complete a weigh-in on a Bluetooth smart scale, the typical data flow looks like this:
- Your scale sends raw measurement data to your phone via Bluetooth
- Your phone’s app processes the data and uploads it to the brand’s cloud servers
- The data may then be shared with third-party analytics platforms, health app integrations (Apple Health, Google Fit), or advertising ecosystems — depending on the brand’s privacy policy
The Mozilla Foundation’s Privacy Not Included research on health and fitness devices found that many health apps share user data with third parties for purposes beyond the core function of the app — including advertising networks and data brokers. Health data, including body composition metrics, is among the most sensitive personal data categories under privacy regulations like GDPR and CCPA.
Cloud storage (most brands): Renpho, Eufy, and many lower-cost brands store data on cloud servers, often in the United States or China depending on the brand’s infrastructure. Your data persists on their servers even if you delete the app — unless you explicitly request account deletion.
Local or limited-cloud storage (premium brands): Withings offers a more detailed privacy policy with explicit user controls. Garmin Connect stores data but has GDPR-compliant deletion tools available for European users. Apple Health, importantly, stores your health data locally on your device by default (with optional encrypted iCloud backup) — giving you more control over your biometric history.
Privacy Red Flags to Watch For
Before purchasing a smart scale, spend five minutes reviewing the brand’s privacy policy. Here are the specific items to look for:
- Green flags (protective practices):
- Explicit statement that data is not sold to third parties
- User-accessible data deletion tool (not just account deletion — all historical data deletion)
- On-device or end-to-end encrypted storage option
- GDPR or CCPA compliance documentation
- Red flags (concerning practices):
- Vague language about “sharing with partners” without specifying which partners
- No user-accessible data deletion option
- Privacy policy that reserves the right to use “anonymized” data for product development (often re-identifiable)
- Required account creation with personal details before the scale will function
- Practical steps:
- Search “[Brand Name] privacy policy” before purchase
- Check whether the brand appears in Mozilla Foundation’s Privacy Not Included database
- After purchase, review your app’s settings for third-party data sharing toggles — many apps default these to “on”
- Set a calendar reminder to review and delete your data annually if you stop using the app
Your body composition data is health data. Treat it with the same care you would apply to a medical record.
Common Mistakes & Limitations
Even users who understand BIA technology make consistent errors that undermine the value of their data. Here are the most frequent pitfalls — and the scenarios where a smart scale simply isn’t the right tool.
Common Pitfalls to Avoid
Pitfall 1: Weighing at inconsistent times. The same person can show a 2–3 kg weight difference and a 3–5% body fat difference between morning and evening readings. If you weigh yourself at random times, your trend data is meaningless — it reflects measurement timing, not body composition change.
Pitfall 2: Weighing on carpet. Carpet surface variation introduces mechanical error into the weight measurement — the strain gauge requires a perfectly rigid surface to read accurately. Even a thick bathroom mat causes problems.
Pitfall 3: Entering outdated personal data. If your height, age, or sex data in the app is inaccurate, every body composition calculation is built on a flawed foundation. Check your app profile annually and update it.
Pitfall 4: Using different apps for the same scale. Some scales are compatible with multiple apps (Renpho Health, Apple Health, Fitbit). Each app may apply its own algorithmic layer — producing different body composition outputs from the same raw reading. Choose one primary app and stick with it for consistent historical comparison.
Pitfall 5: Obsessing over daily fluctuations. Daily BIA readings can swing 2–4% in body fat percentage for reasons that have nothing to do with actual body composition. Checking your scale multiple times a day or reacting emotionally to single readings is the most common misuse of the technology — and can negatively affect your relationship with your body and your data.
When to See a Professional
A smart scale is a monitoring tool, not a diagnostic device. There are specific scenarios where you should seek more accurate clinical assessment:
For clinical body composition assessment: If you need precise body fat and lean mass data for medical, athletic, or rehabilitation purposes, a DEXA scan is the gold standard. Many sports medicine clinics and university athletic facilities offer DEXA scans for $100–$250. Results are typically available within 30 minutes and include regional body composition breakdowns (arms, legs, trunk, android/gynoid fat distribution).
For elite athletic performance tracking: Professional athletes and serious competitors should consider hydrostatic (underwater) weighing or air displacement plethysmography (Bod Pod) — both of which are significantly more accurate than consumer BIA for body composition measurement. Many university sports science departments and performance centers offer these services.
- When to consult a healthcare professional:
- If your body fat reading is at clinical extremes (below 5% for men or below 12% for women) — see a doctor regardless of scale accuracy questions
- If you have unexplained rapid weight changes (more than 2–3 kg per week without intentional dietary change) — this warrants medical evaluation, not just scale recalibration
- If you have a chronic health condition (kidney disease, heart failure, lymphedema) that affects fluid distribution — BIA readings will be systematically unreliable, and clinical assessment is necessary
- If you are making significant dietary or medical decisions based on body composition data — consult a registered dietitian or physician who can interpret body composition data alongside clinical context
A smart scale is not a diagnostic device. For clinical body composition assessments, always consult a doctor or registered dietitian.
Frequently Asked Questions
How do smart scales work?
Smart scales use Bioelectrical Impedance Analysis (BIA) to estimate body composition beyond weight. The scale sends a small, imperceptible electrical current through your body via electrode pads under your feet. Muscle tissue, which is high in water content, conducts the current efficiently. Fat tissue resists it. The scale measures that resistance, combines it with your age, height, sex, and weight, and runs the combined data through a proprietary algorithm to estimate body fat percentage, lean mass, visceral fat, and other metrics. Weight is the only directly measured value; all other readings are estimates.
Are smart scales accurate?
Smart scales are highly accurate for body weight — typically within ±0.1–0.2 lbs of clinical scales. Body composition readings are less precise. Consumer-grade BIA devices show meaningful differences compared to clinical DEXA scans, particularly for individuals with higher BMI, per research in the National Institutes of Health database (NIH PMC, 2021). Body fat percentage estimates carry error ranges that vary by individual factors including hydration, age, and fitness level. The most reliable use of a smart scale is tracking trends over four to eight weeks — not interpreting single readings as absolute truth.
How do smart scales know your fat percentage?
Smart scales estimate fat percentage using five variables: the measured electrical impedance from your feet, plus your body weight, height, age, and biological sex — all entered in your app. Fat tissue resists the electrical current more than muscle tissue does, because fat contains far less water. The scale’s algorithm compares your impedance signature to population study data and calculates where your body composition likely falls on that distribution. It never directly “sees” fat — it estimates it from resistance patterns. This is why readings vary by brand (different algorithms) and by hydration state (water content changes resistance).
What are the disadvantages of smart scales?
The main disadvantages of smart scales are accuracy variability, data privacy risks, and a tendency to encourage misleading single-reading interpretation. Body composition readings — particularly body fat %, muscle mass, protein, and bone estimates — can vary by 2–5% or more depending on hydration, time of day, recent exercise, and food intake. Readings from different brands are not directly comparable due to proprietary algorithms. Additionally, most smart scale apps transmit your biometric data to cloud servers, where data sharing practices vary significantly by brand. Smart scales also cannot replace clinical body composition assessment — they are trending tools, not diagnostic instruments.
Is your true weight morning or night?
Your most consistent and clinically reproducible weight is taken in the morning — immediately after waking, after using the bathroom, and before eating or drinking. Research and medical guidance consistently support morning weigh-ins as the baseline standard because they control for the largest sources of daily variability: food, fluid intake, and activity. Body weight typically varies by 0.5–2 kg across the day for most adults. Evening readings are systematically higher because they include the cumulative weight of the day’s food and fluid intake. For smart scale trend tracking, the Cleveland Clinic recommends consistent timing above all else — if morning is not feasible, choose another fixed time and use it every day.
Conclusion
For health-conscious adults who want to track body composition at home, a smart scale is one of the most accessible and consistently useful monitoring tools available — provided you understand what it is actually measuring. The Accuracy Spectrum makes that clear: your weight reading is reliable, your body fat trend over four to eight weeks is meaningful, and your protein and bone readings are calculated projections that serve as rough orientation points rather than trackable health metrics. Consumer-grade BIA devices show lower accuracy for body composition than clinical DEXA scans — particularly for individuals with higher BMI — but they excel at daily trend tracking that no clinic-based measurement can match for frequency and convenience (NIH PMC, 2021).
The right approach combines both: use your smart scale to monitor the trend, and a DEXA scan occasionally to calibrate your baseline. The Accuracy Spectrum is the mental model that resolves most smart scale frustration. When you know that weight is high-confidence and protein mass is a projection, you stop agonizing over daily body fat swings and start reading the trend line. The five-variable BIA algorithm explains why the same person gets different readings from different brands — and why your hydration the night before matters more than the scale’s sensor quality. Apply the 5-Rule Calibration Protocol every morning, and your data becomes genuinely comparable from week to week.
Your next step: Apply the Calibration Protocol for the next seven mornings — same time, same conditions, hard surface, bare feet, post-bathroom, pre-breakfast. After one week, you will have a baseline trend that is far more informative than any single reading you’ve seen so far. If you want to see how 12 popular models perform across real-world testing, check our comprehensive testing review shows exactly which consumer scales produce the most consistent readings — and which ones introduce the most noise.
